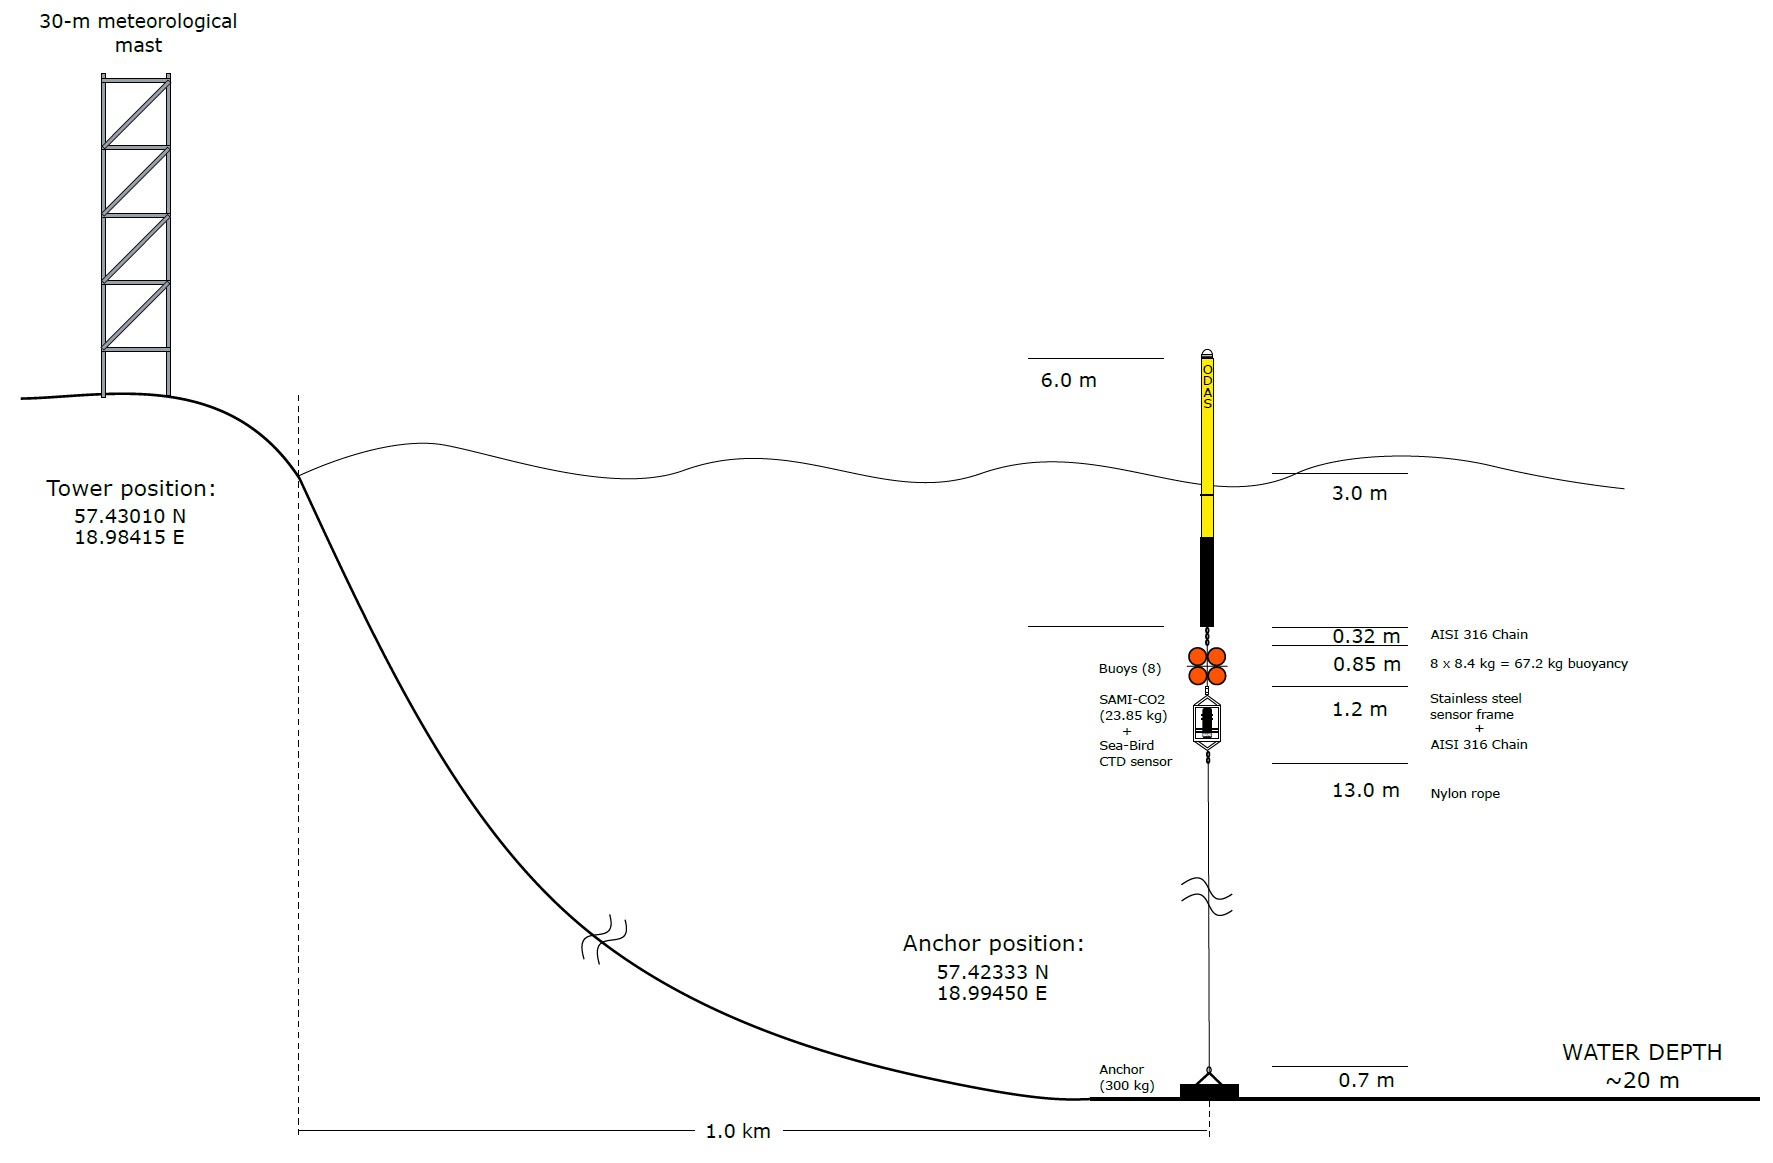
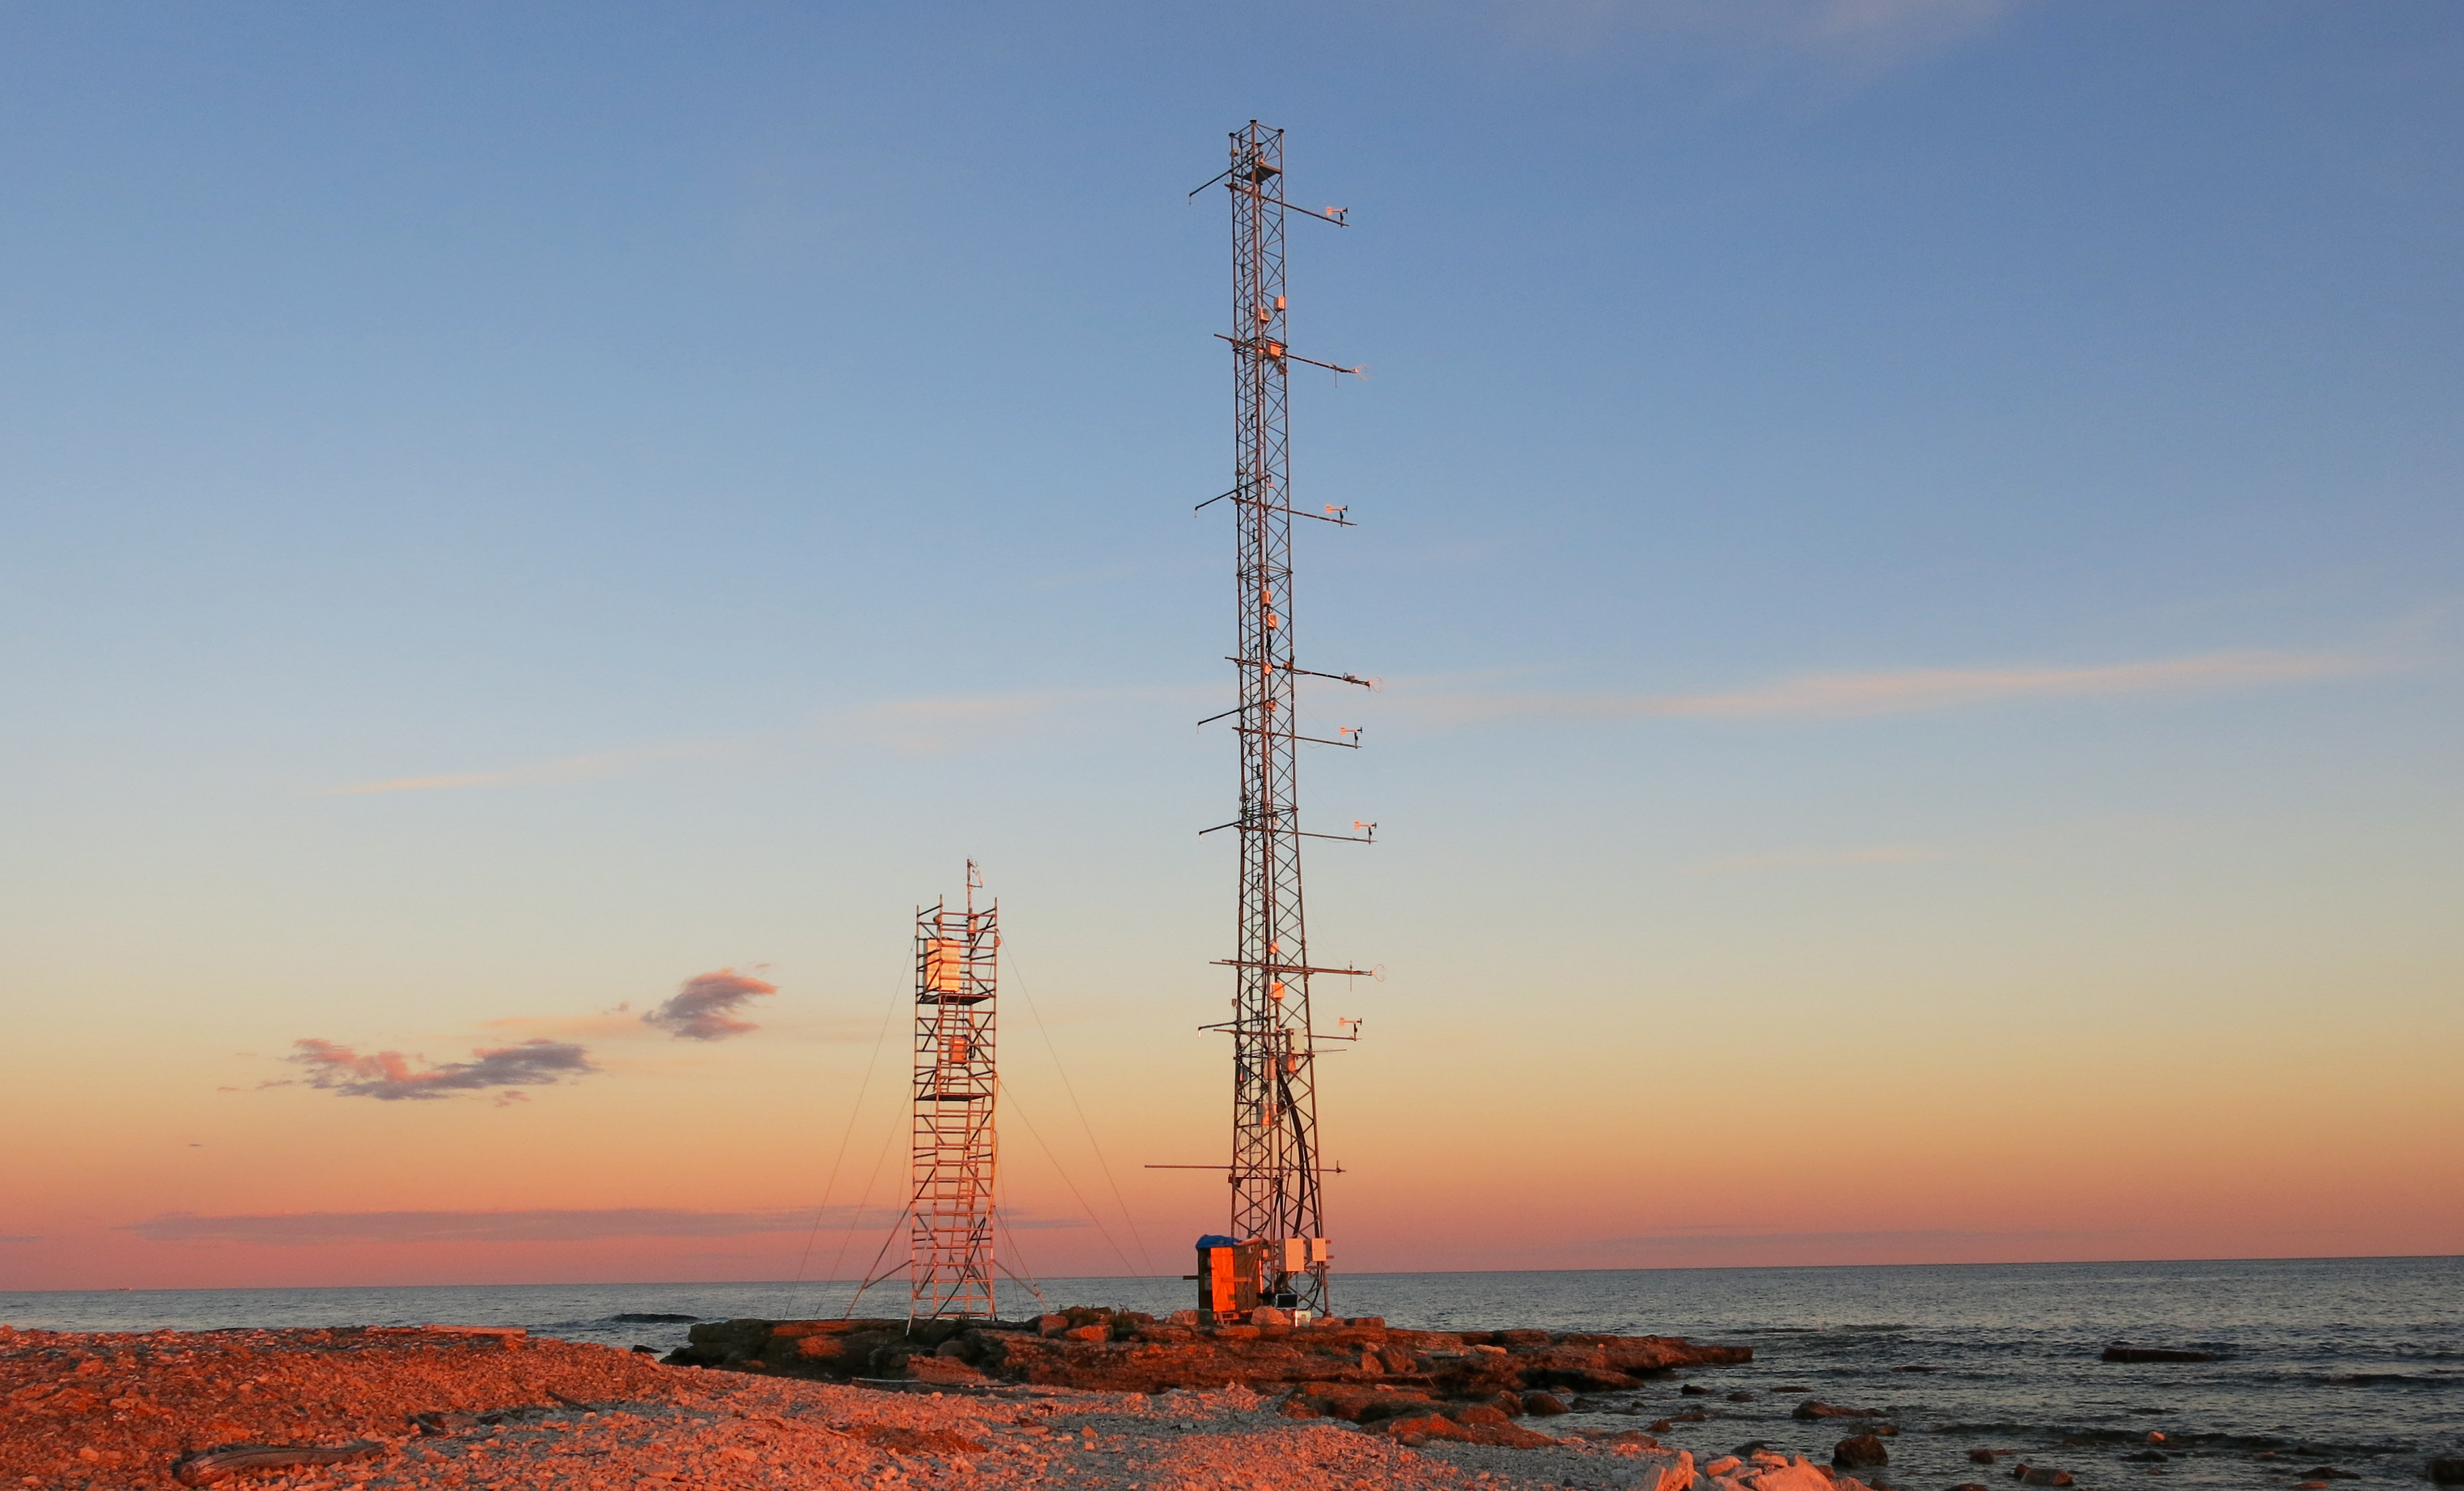
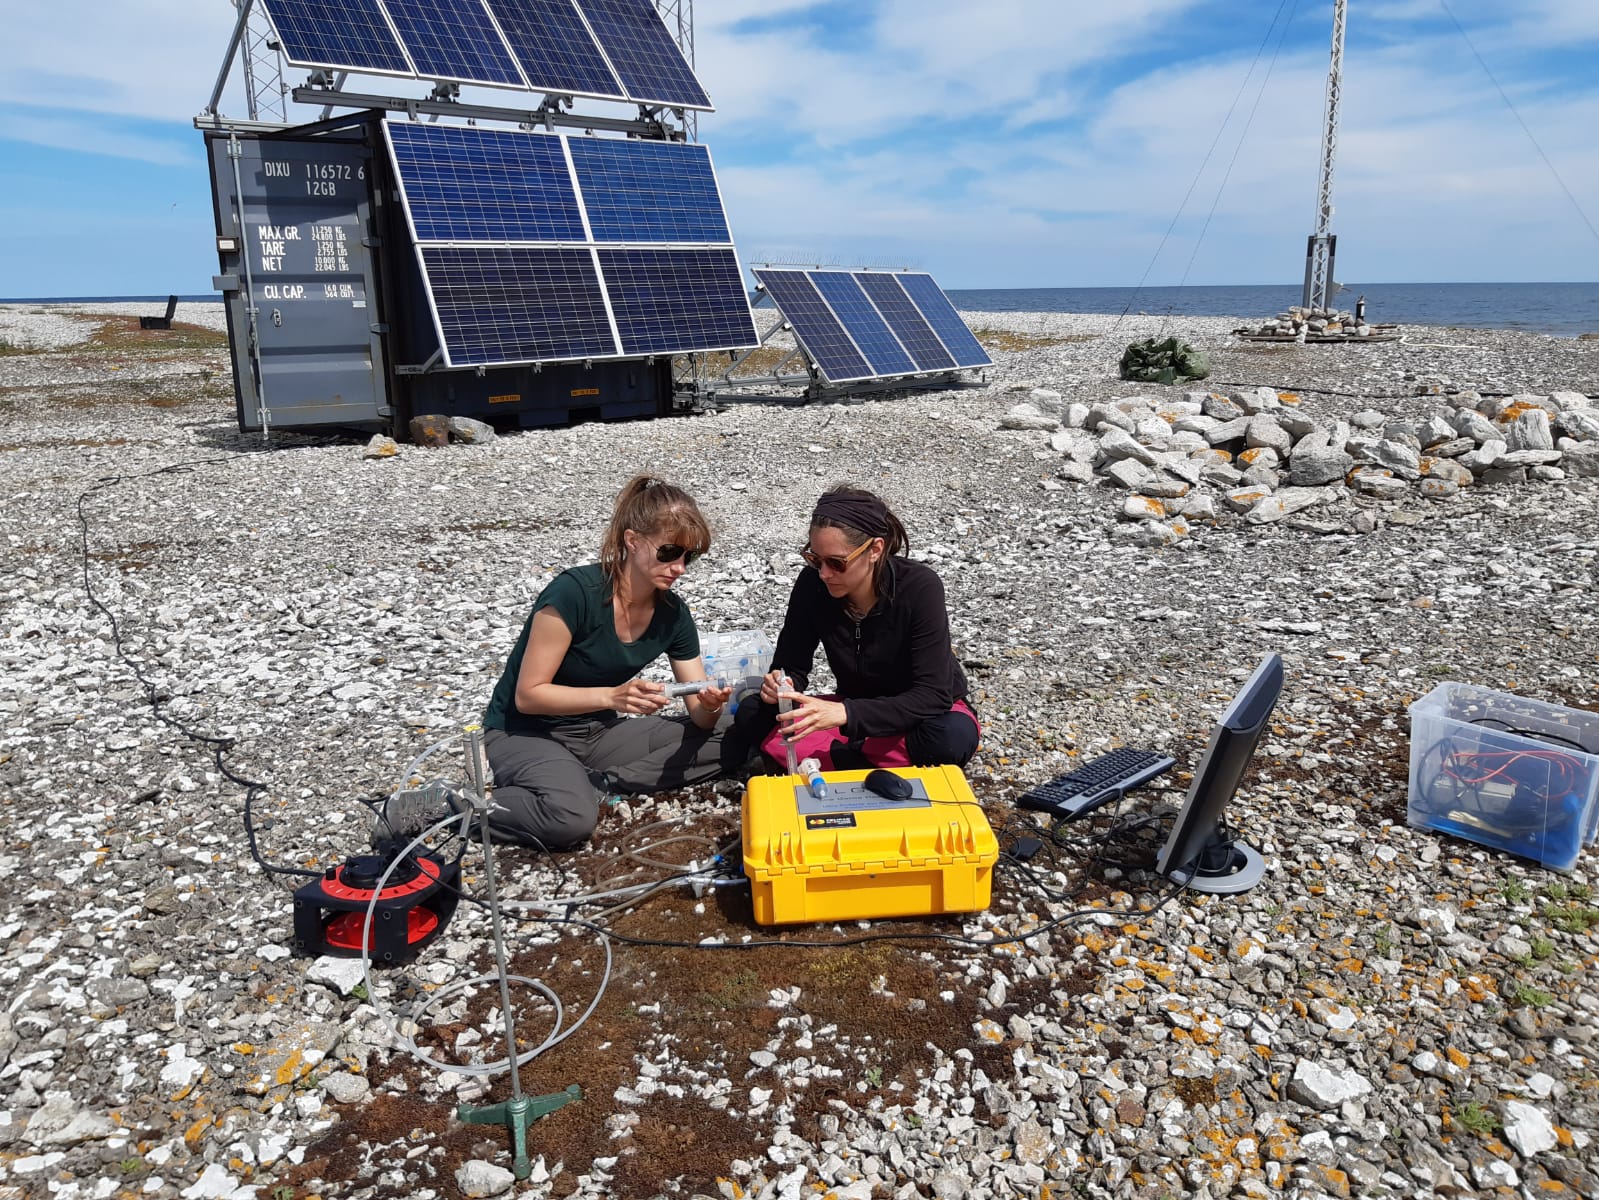
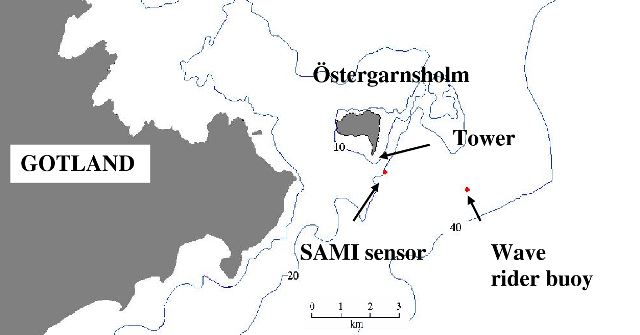
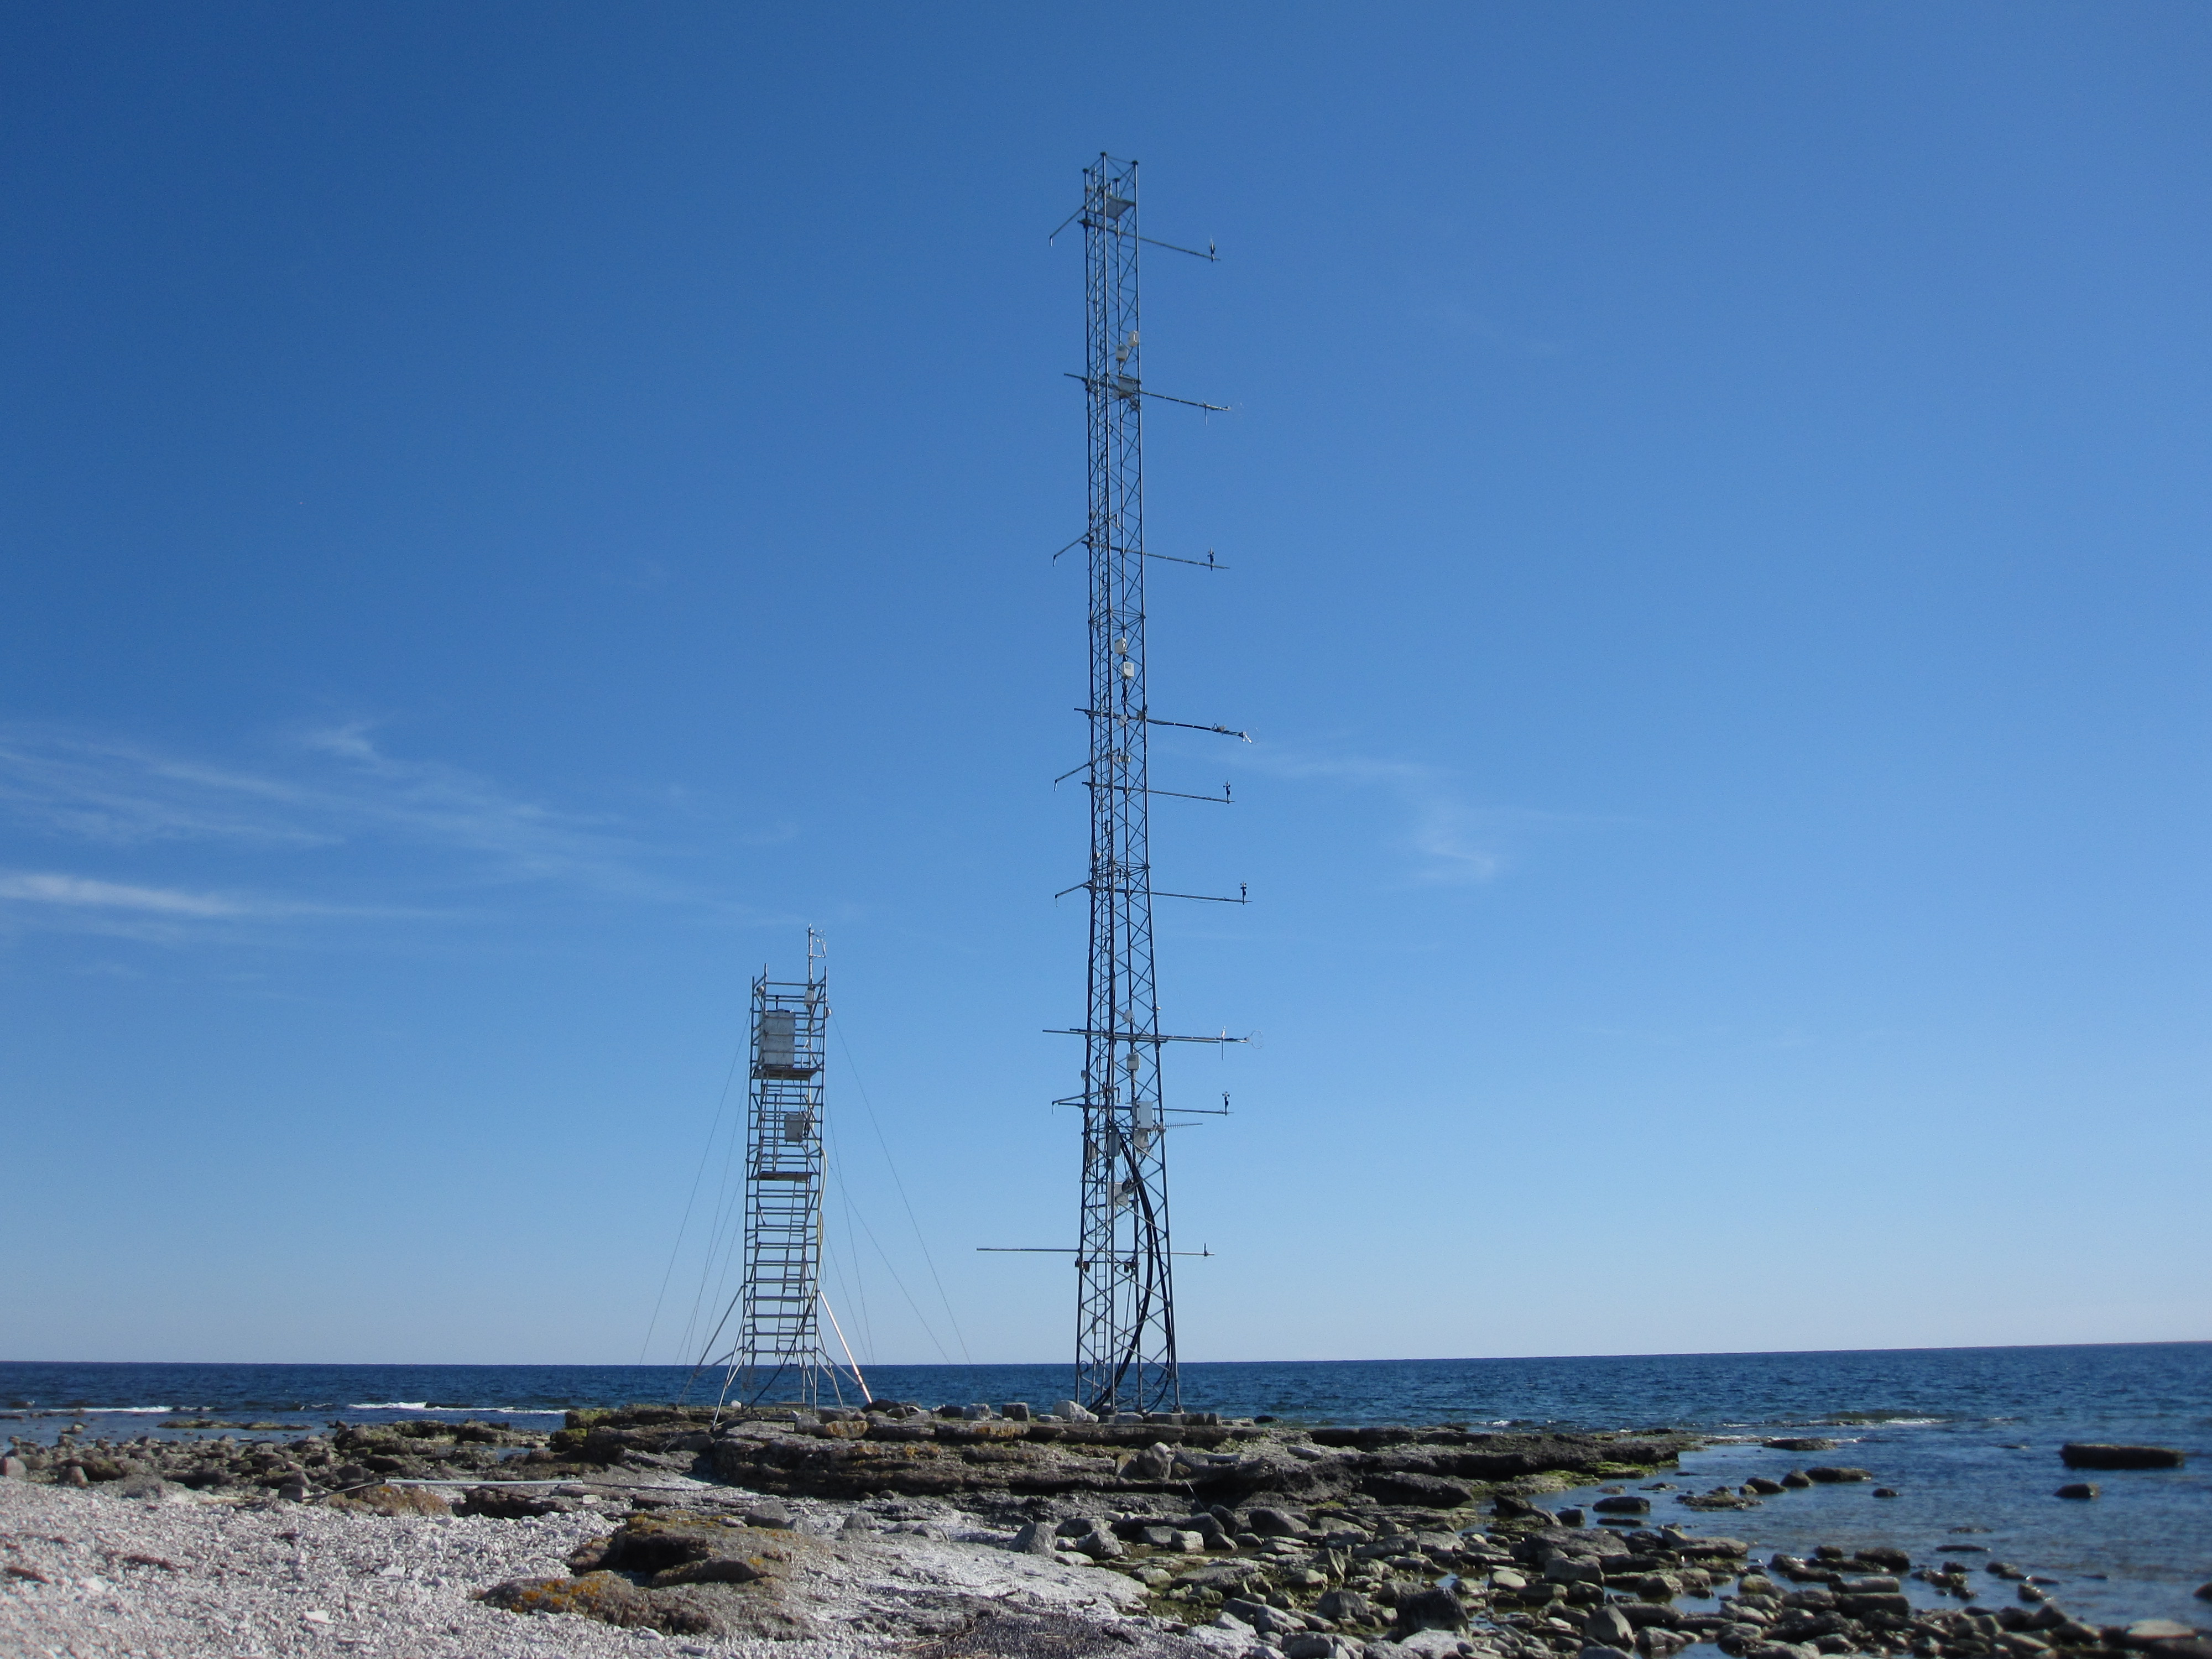
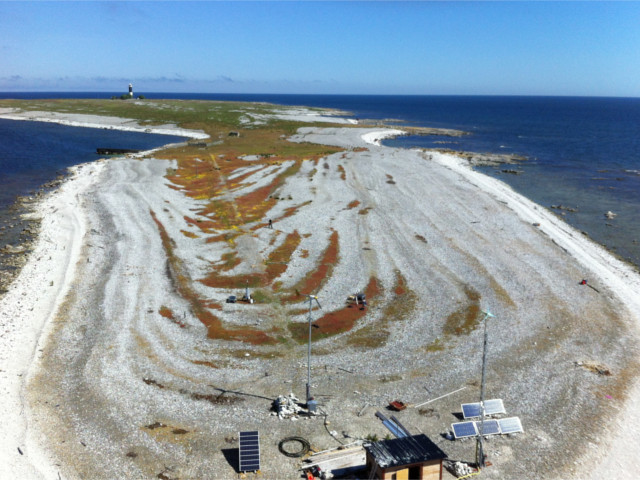
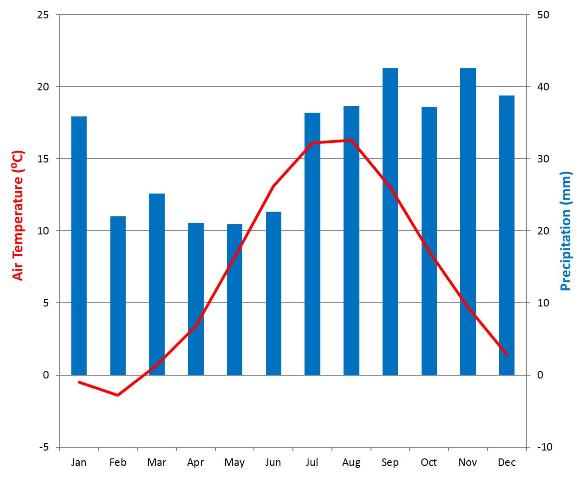
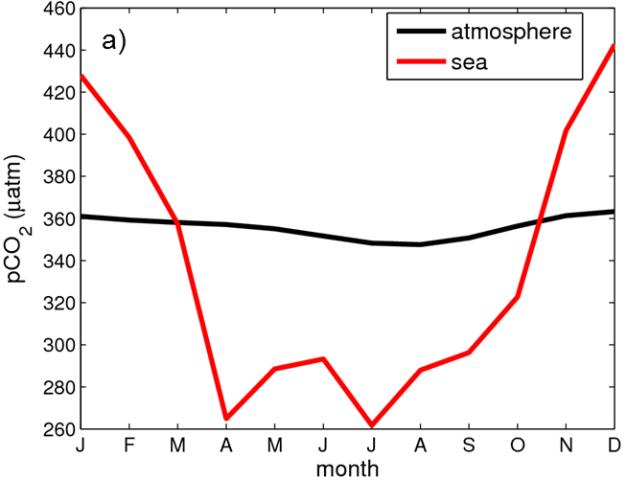
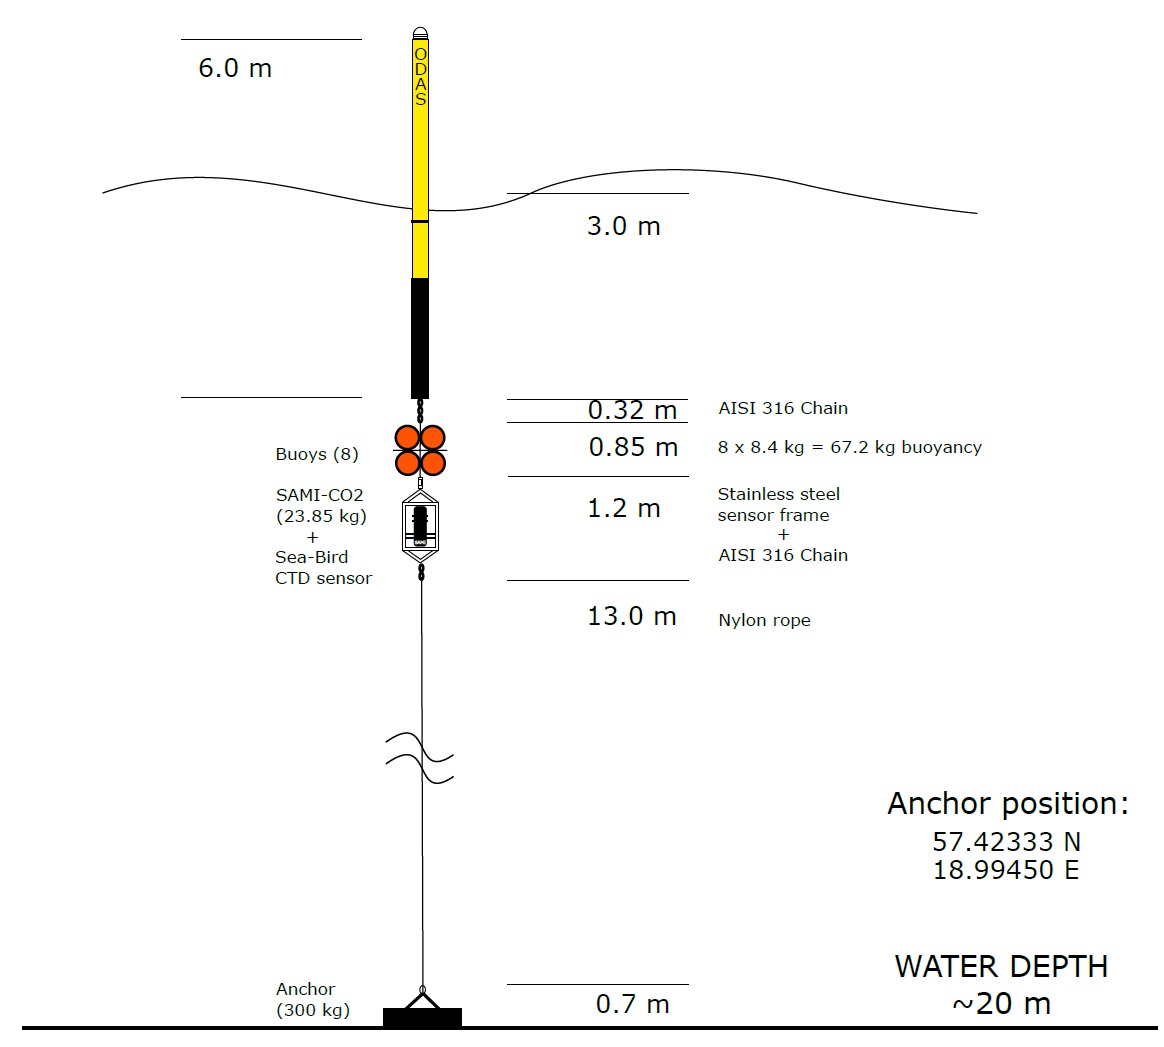
Schematic of water-side buoy system located about 1 km from the measurement tower. Photograph of the 30 m main measurement tower maintained by Uppsala University since 1995 and also a smaller 10 m tower instrumented for studying aerosol fluxes and air-sea exchange operated by Stockholm University.Researchers and PhD students working on analysis of water samples taken at the site for quantification and validation of carbon dioxide and methane concentration in the Baltic Sea.Sketch of the island Östergarnsholm, east coast of Gotland and location of the 30 m tower, water buoy sensor and wave rider buoy location.Measurement masts at the site.Photograph of the vegetation at Östergarnsholm including parts of the site infrastructure. The photo was taken before an updated power supply system was installed (in November 2016).Climate diagram Östergarnsholm (data period 1961-1990, SMHI station Östergarnsholm). The diagram displays monthly averages for temperature and precipitation. When the precipitation curve undercuts the temperature curve, this indicates dry season. When the precipitation curve exceeds the temperature curve, this indicates moist seasonModeled partial pressure of CO2 (pCO2) in atmosphere and sea at Östergarnsholm.
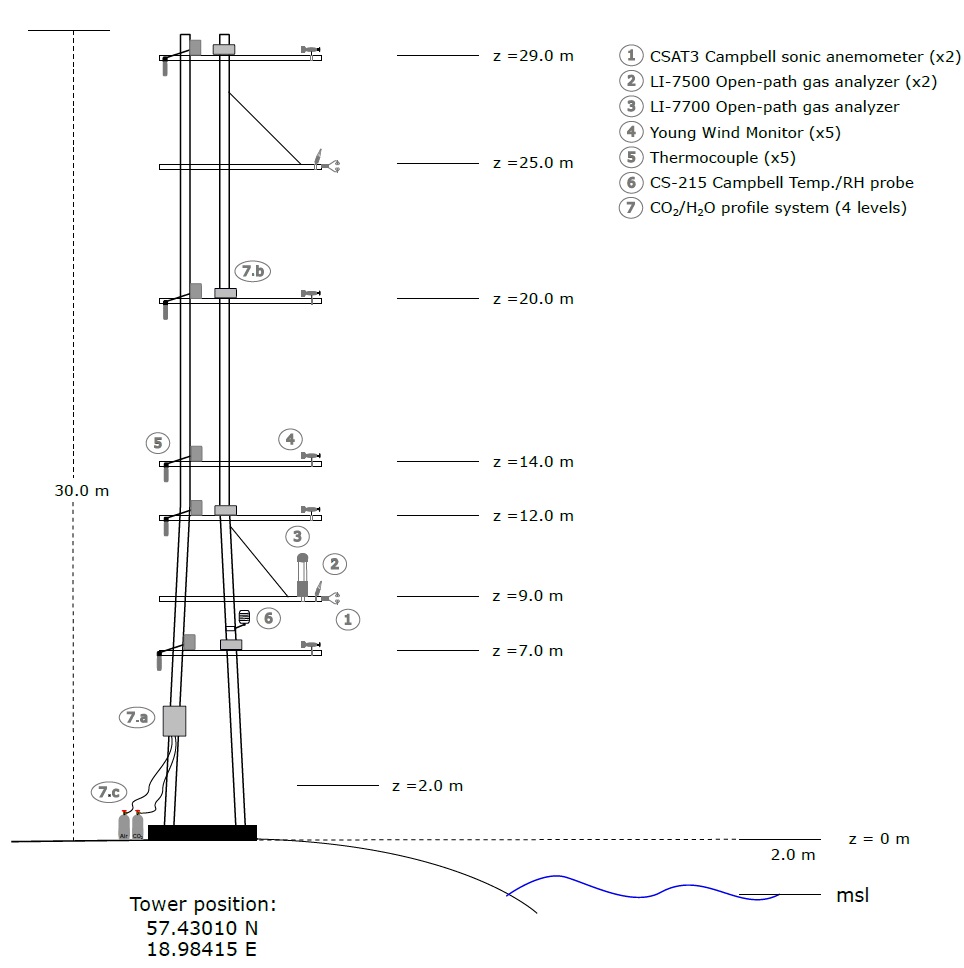
Figure 1: Photograph from the base of the 30 m measurement tower. Sensors at different heights have changed for different time periods.Illustration of the 30 m tower with approximative heights of the different levels. Sensors at different heights have changed for different time periods and missing data at one or several levels is historically not uncommon because of power supply issues and maintenance delays because of the remote location of the site. Sketch of the design of the water-side buoy measurement setup about 1 km from the tower.