Home
ICOS Sweden
  • About
    • Our Mission
    • ICOS Sweden organization
    • Steering Documents
  • Data
    • Current Weather Data
    • Data availability and download information
    • Data citation
  • Network and measurements
    • Abisko-Stordalen
    • Degerö
    • Hyltemossa
    • Lanna
    • Mycklemossen
    • Norunda
    • Svartberget
    • Tavastland
    • Östergarnsholm
  • Science & Impact
    • Recent Research
    • Publications
    • Collaborations
  • News & events
  • Contacts
  • resurs för skolor
    • tematisk sortering
    • aktiviteter
31 October 2025

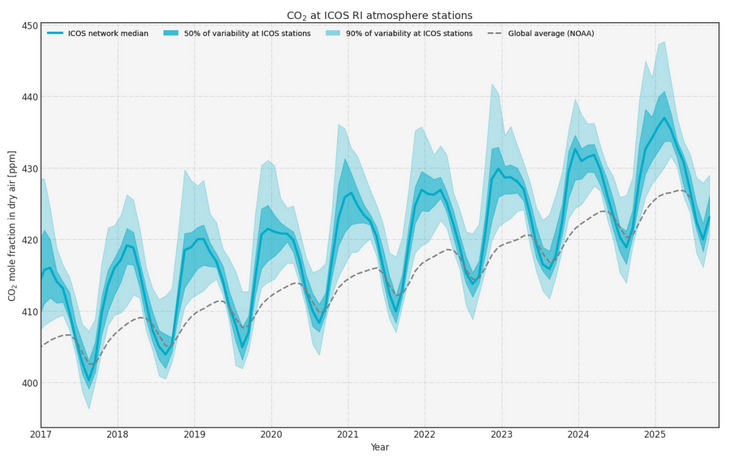
On October, 30, the new ICOS curve was launched by ICOS ERIC. The interactive web service allows you to plot greenhouse gas concentrations (CO2, CH4 or N2O) measured at ICOS Atmosphere stations. 

Read more about the launch in the ICOS ERIC news article.

Learn how to use the interactive tool and what it actually shows.

Use the interactive tool without further explanations.

snapshot ICOS curve
  • Log in to post comments

Coordination Office

ICOS Sweden Coordination Office
Department of Physical Geography and Ecosystem Science
Lund University
Sölvegatan 12
S-223 62 Lund

Contact us

ICOS links

ICOS RI

ICOS Carbon Portal 

Atmosphere Thematic Centre

Ecosystem Thematic Centre

Ocean Thematic Centre

Central Analytical Laboratories

Partners and funders

Logotypes partners