Location
The Svartberget site (64°15′N, 19°46′E, 270 m asl) is located about 60 km west of Umeå.
General
The Svartberget site is located in the Svartberget Experimental Forest. The experimental forest covers 1076 ha of boreal forest land and governs a manifold of research activities since 1923. A reference monitoring program of climate and water is active since 1980.
The site was established for ICOS Sweden in 2011 and hosts a Class 2 combined Ecosystem and Class 1 Atmosphere station.
The research site which is co-located with the national infrastructures SITES and ACTRIS Sweden. The ACTRIS activities at Svartberget are operated by SLU.
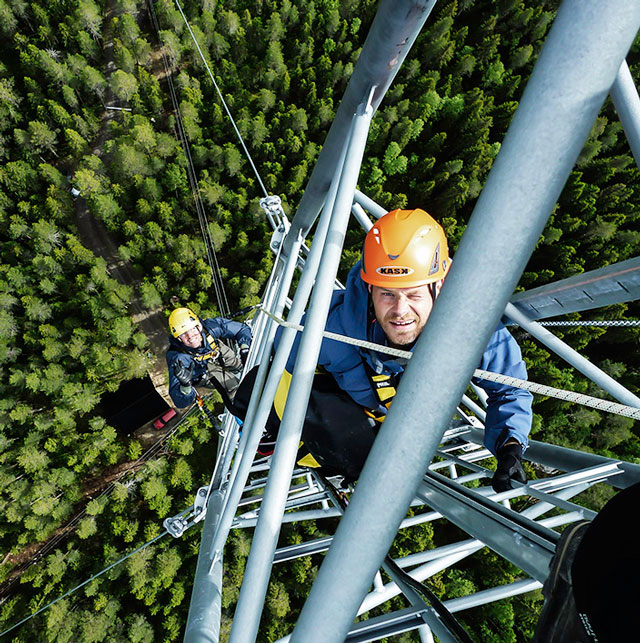
![]() ICOScapes presenting Svartberget
ICOScapes presenting Svartberget
Staff and Contact
- Ecosystem station PI: Matthias Peichl
- Atmosphere station PI: Eric Larmanou
- other station staff: Fabio Boschetti, Pernilla Löfvenius
contact: svartberget@icos-sweden.se
Data download
Data from Svartberget can be downloaded from the ICOS Carbon Portal.
ICOS Level2 data from the Atmosphere Station SVB (GHG concentrations, air temperature, wind).
ICOS Level2 data from the Ecosystem Station SE-Svb (flux data, meteorological data, soil meteorological variables, ancillary data).
ICOS Level 1 Near Realtime Data
Information about the boundary height of the last days can be viewed at the webpage of the EUMETNET - e-profile project webpage and downloaded from the CEDA Archive.
Data gathered through the SITES RI: Svartberget,Krycklan
Geology and Soil
The bedrock consists almost entirely of gneiss. The dominating soil type is moraine of various thicknesses.
A detailed analysis of the soil conditions can be found in the ICOS ETC soil report for Svartberget: ICOS ETC soil report Svartberget.
The soil property data can also be downloaded from the Carbon Portal as part of the ICOS Level 2 data archive. The description of the methodology and sampling design can be found following this link: https://traitementinfosol.pages-forge.inrae.fr/icos/DB_Theory.html
Vegetation
The Svartberget site is situated on a slope in a 100 years old mixed forest with 60% Scots pine Pinus sylvestris and 40% Norway spruce Picea abies. Tree height close to the tower is about 20m.
Follow this link to access the full ancillary data report of Svartberget provided by the ICOS ETC.
overstory species composition (last inventory: 2018) | |||
|---|---|---|---|
| species | trees/ha | percentage | Basal Area (m2/ha) |
| all trees | 1062.5 | 100 | 29.322 |
| Picea Abies L. | 535.4 | 68.2 | 12.701 |
| Pinus sylvestris L. | 414.7 | 19.9 | 14.029 |
| Betula pendula Roth. | 111.7 | 11.9 | 2.589 |
| Sorbus aucuparia L. | 0.7 | 0.002 | |
main tree species characteristics (last inventory: 2019) | |||
|---|---|---|---|
| species | DBH1 (cm) | standard deviation (DBH)(cm) | height2 (m) |
| all trees | 16.97 | 7.96 | 22.4 (SP), 19.9 (CP) |
| Picea abies L. | 15.49 | 7.89 | 22.6 (SP), 18.4 (CP) |
| Pinus sylvestris L. | 19.36 | 7.48 | 22.5 (SP), 22.0 (CP) |
| Betula pendula Roth | 15.29 | 7.83 | 22.2 (SP), 19.2 (CP) |
1DBH: measured at 1.3 m, minimum diameter: 5 cm
2height: arithmetic men of the 10% tallest trees
overstory GREEN area index2 | ||||
|---|---|---|---|---|
| date | mean GAI (m2/m2) | standard deviation (m2/m2) | clumping factor | |
| 2019 | Jun, 20 | 3.19 | 0.80 | 0.904 |
| Jul | 3.40 | 0.64 | 0.906 | |
| Sep | 3.47 | 0.48 | 0.897 | |
| 2020 | Jun | 3.19 | 0.62 | 0.896 |
| Jul | 3.39 | 0.71 | 0.889 | |
| Sep, 8 | 3.67 | 0.55 | 0.882 | |
| Sep, 21 | 3.61 | 0.45 | 0.900 | |
| 2021 | Aug | 3.53 | 0.64 | 0.890 |
| Sep | 3.12 | 0.35 | 0.914 | |
| 2024 | Jun | 3.51 | 0.55 | 0.908 |
| Jul | 3.49 | 0.55 | 0.912 | |
| Aug | 3.59 | 0.59 | 0.910 | |
| Sep | 3.46 | 0.54 | 0.913 | |
| 2025 | May (only CP5) | 2.98 | 0.696 | 0.982 |
| Jun (only CP5) | 3.15 | 0.79 | 0.984 | |
| Jul | 3.46 | 0.43 | 0.906 | |
2approach: 9 DHP pictures were taken in each of 3 continuous plots. LAI was calculated at each location (9 per plot) and averaged per plot. Only QC checked pictures were included. For each CP 7 or more pictures should be suitable to include plot in aggregation.
Foliar analyses | ||||||||||
|---|---|---|---|---|---|---|---|---|---|---|
| concentration in sample dried at 65°C dry mass ratio: (dry mass at 103 °C) / (dry mass at 65 °C) | ||||||||||
| parameter | species | 2017 | 2018 | 2019 | 2020 | 2021 | 2022 | 2023 | 2024 | 2025 |
| Ca (g/kg) | Picea abies L. | 7.81 | 9.39 | 6.69 | 6.55 | 7.28 | 8.42 | 9.04 | 7.48 | 8.17 |
| Pinus sylvestris L. | 3.67 | 3.76 | 3.29 | 2.95 | 3.30 | 4.01 | 4.01 | 3.91 | 3.75 | |
| Cu (mg/kg) | Picea abies L. | 1.41 | 1.36 | 1.64 | 1.10 | 1.15 | 1.44 | 1.44 | 1.65 | 0.83 |
| Pinus sylvestris L. | 2.11 | 2.60 | 2.52 | 2.38 | 1.98 | 2.33 | 2.51 | 3.52 | 2.64 | |
| Fe (mg/kg) | Picea abies L. | 14.083 | 16.505 | 13.857 | 15.24 | 9.28 | 11.86 | 15.42 | 14.68 | 7.25 |
| Pinus sylvestris L. | 14.03 | 18.14 | 19.16 | (19.77) | 16.86 | 17.62 | 21.49 | 21.21 | 21.93 | |
| Mg (g/kg) | Picea abies L. | 0.93 | 0.95 | 0.94 | 0.94 | 0.92 | 1.18 | 1.09 | 0.94 | 1.08 |
| Pinus sylvestris L. | 0.74 | 0.74 | 0.68 | 0.71 | 0.69 | 0.72 | 0.75 | 0.80 | 0.67 | |
| Mn (mg/kg) | Picea abies L. | 439.9 | 642.2 | 362.8 | 418.8 | 405.9 | 439.6 | 561.8 | 418.4 | 306.4 |
| Pinus sylvestris L. | 132.4 | 217.5 | 211.1 | 186.4 | 190.1 | 138.4 | 213.19 | 162.3 | 163.5 | |
| C (g/kg) | Picea abies L. | 510.0 | 512.7 | 512.8 | 514.4 | 516.1 | 510.8 | 507.3 | 512.4 | 508.8 |
| Pinus sylvestris L. | 532.1 | 540.0 | 535.4 | 533.9 | 535.3 | 535.3 | 533.4 | 535.8 | 531.8 | |
| N (g/kg) | Picea abies L. | 9.62 | 10.46 | 10.20 | 9.77 | 10.31 | 10.21 | 10.34 | 9.34 | 9.34 |
| Pinus sylvestris L. | 12.14 | 12.68 | 12.41 | 12.27 | 12.37 | 12.26 | 13.4 | 12.8 | 11.6 | |
| P (g/kg) | Picea abies L. | 1.21 | 1.26 | 1.31 | 1.36 | 1.27 | 1.38 | 1.46 | 1.43 | 1.27 |
| Pinus sylvestris L. | 1.26 | 1.28 | 1.33 | 1.37 | 1.25 | 1.30 | 1.36 | 1.38 | 1.24 | |
| K (g/kg) | Picea abies L. | 4.99 | 5.62 | 6.31 | 6.32 | 5.69 | 5.67 | 5.73 | 5.99 | 5.21 |
| Pinus sylvestris L. | 5.12 | 5.19 | 5.83 | 6.17 | 5.54 | 5.45 | 5.74 | 6.03 | 5.39 | |
| Zn (mg/kg) | Picea abies L. | 48.6 | 53.1 | 42.8 | 47.4 | 44.3 | 49.7 | 49.31 | 50.34 | 48.28 |
| Pinus sylvestris L. | 46.0 | 49.1 | 45.4 | 44.26 | 40.79 | 50.78 | 51.66 | 50.08 | 43.21 | |
| dry mass ratio (%) | Picea abies L. | 93.69 | 84.29 | 74.76 | 93.68 | 92.91 | 91.50 | 93.44 | 87.62 | 89.6 |
| Pinus sylvestris L. | 93.83 | 79.04 | 69.42 | 93.61 | 92.58 | 91.23 | 93.20 | 88.1 | 86.81 | |
Climate
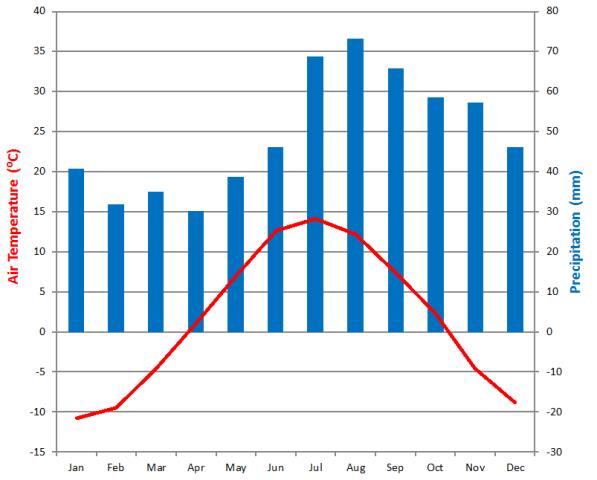
The cold humid climate type of the site is attributed by relatively short summer (the growing season is 150 days/year) and permanent snow cover during winter (170 days/year). The mean annual air temperature is 1.8°C and annual precipitation sums up to 614 mm (data period 1981-2010).
Data for the 1961-1990 climatological normal from the close by SMHI station Vindeln characterizes the climate as a Dfc-climate (after Köppen), i.e. humid subarctic with cold summers and cold winters.
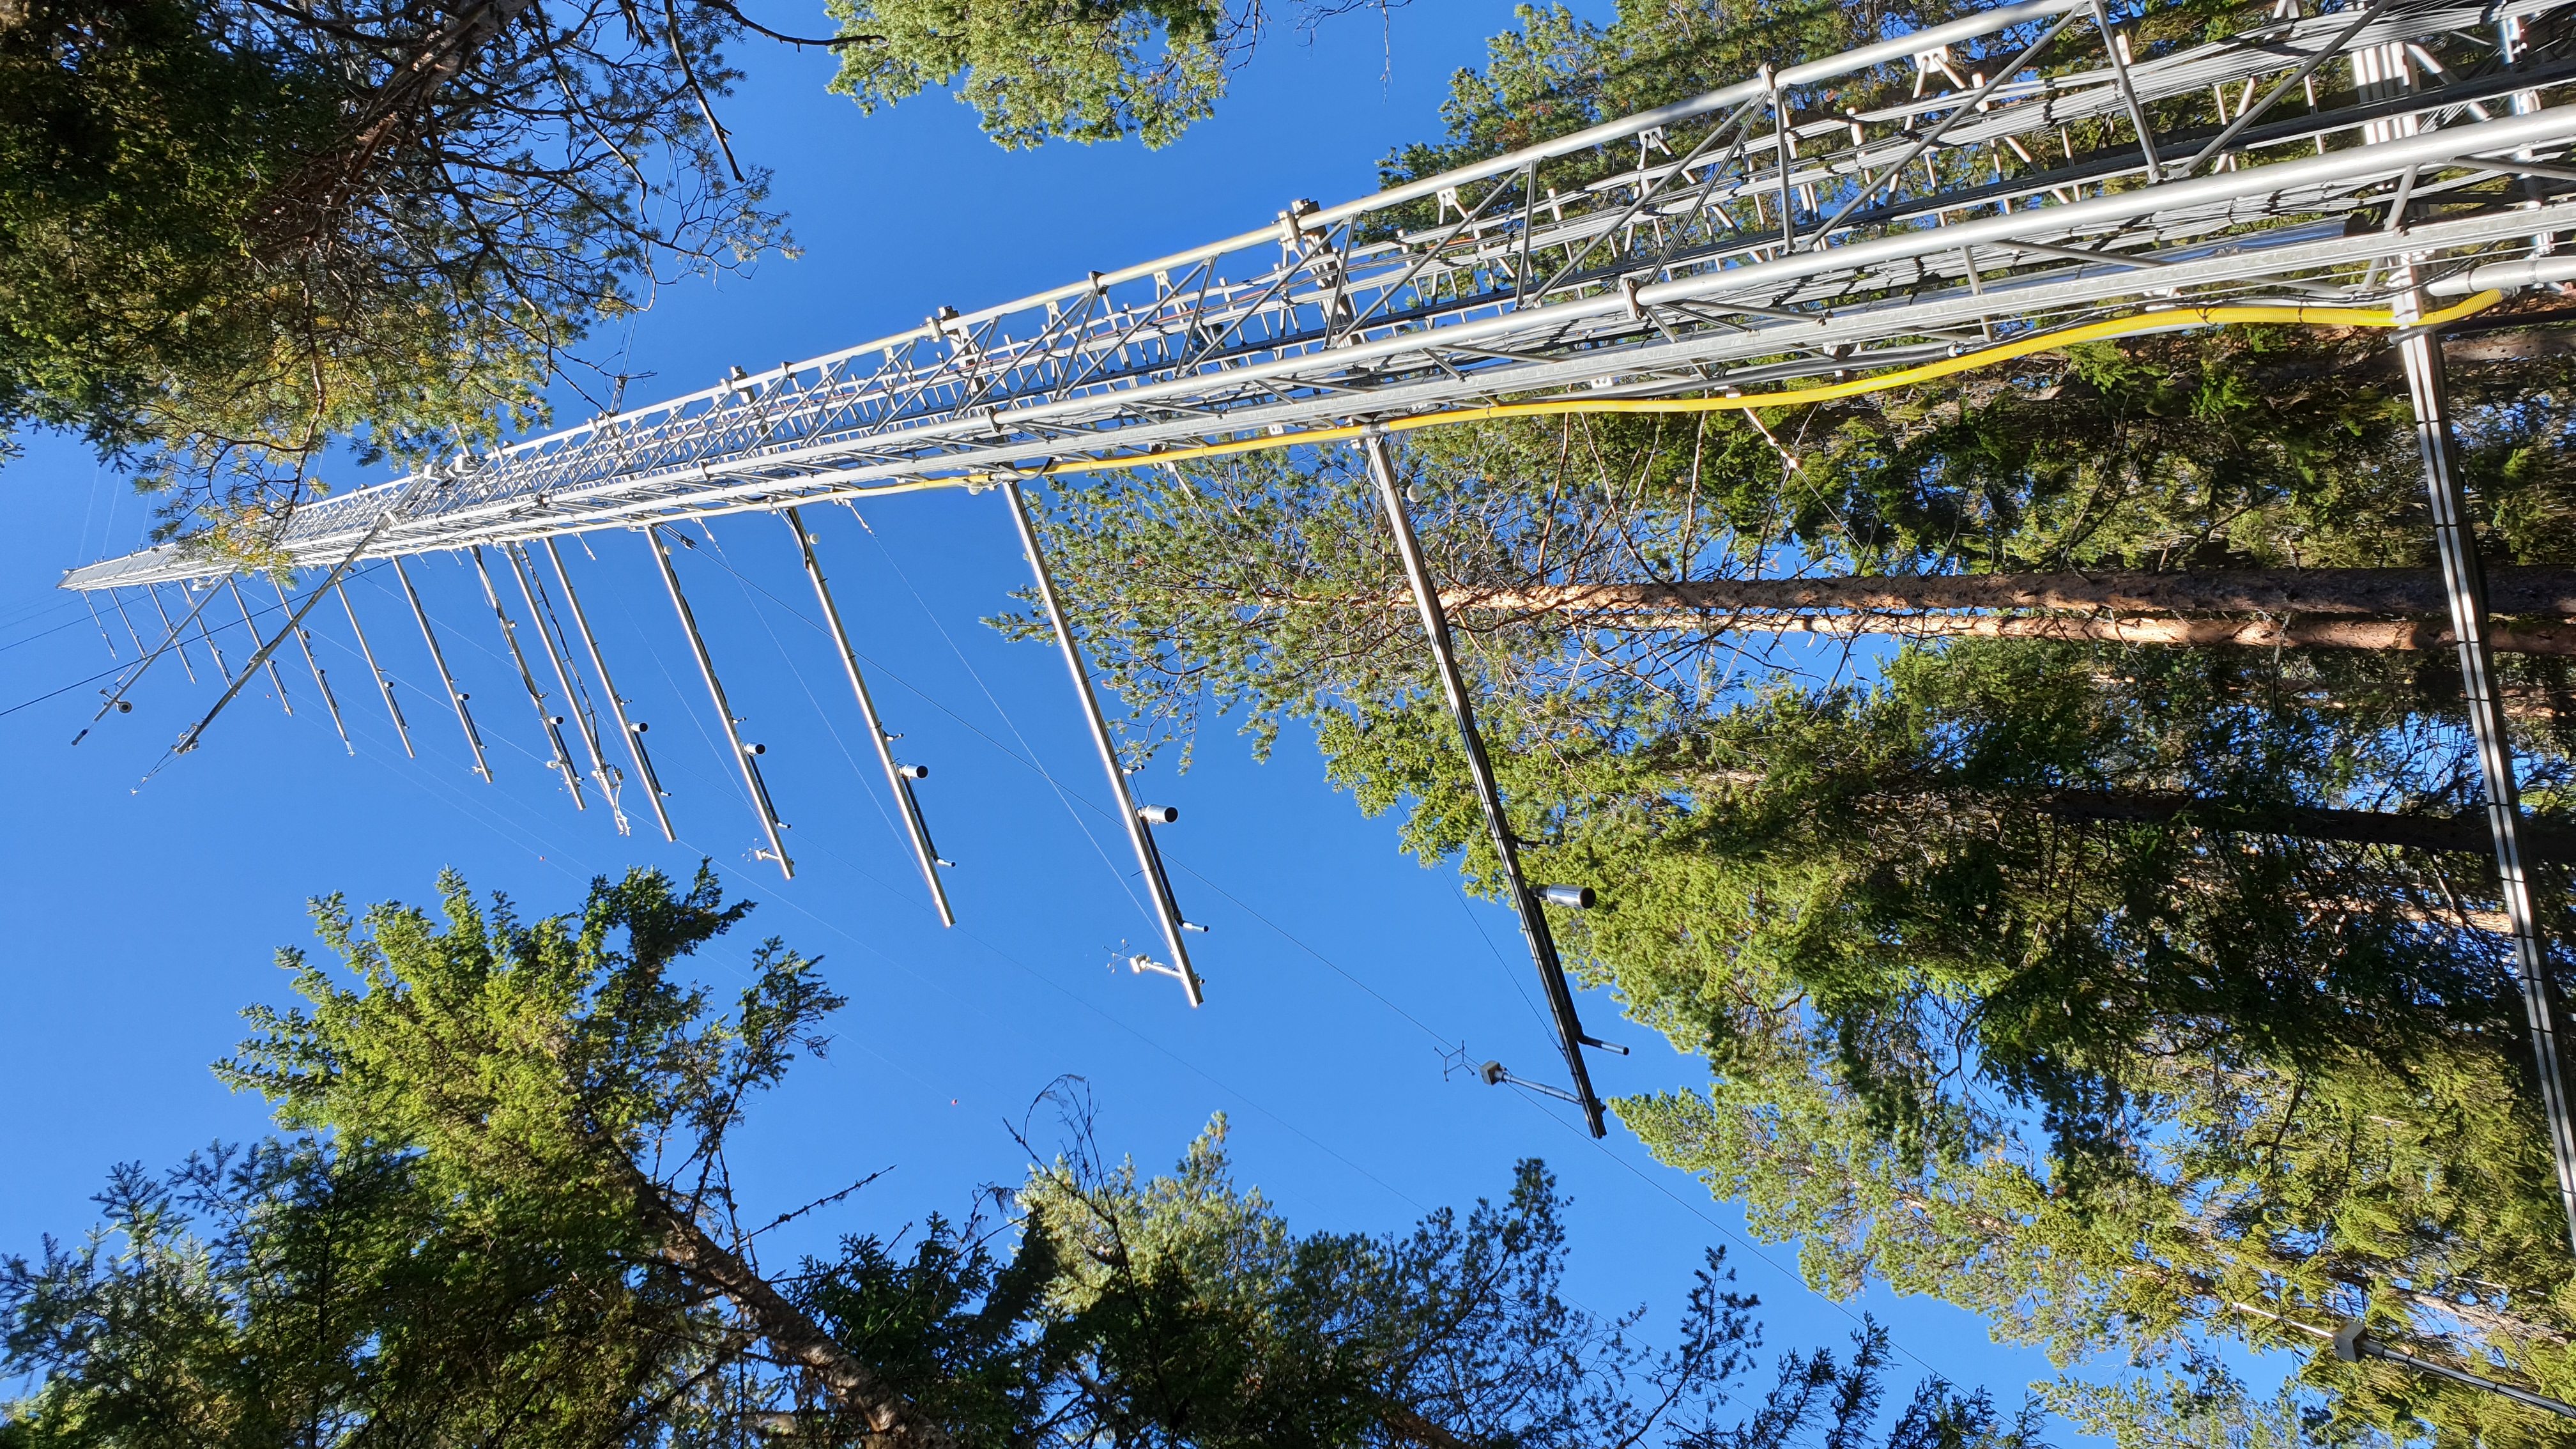
Measurements
The measurements are carried out either on the 150 m high tower, at the earth surface, in the four soil pits or on the four trees. All measurements are carried out within a distance of about 200 m of the tower.
Measured Atmosphere station variables
Variables and measurement heights included in the Atmosphere station program at Svartberget are listed on the Atmosphere station introduction page: follow this link to the page
Measured Ecosystem station variables and summary of station parameters
Variables and measurement heights included in the Ecosystem station program at Svartberget are listed on the Ecosystem station introduction page: follow this link to the page
Non-ICOS measurements
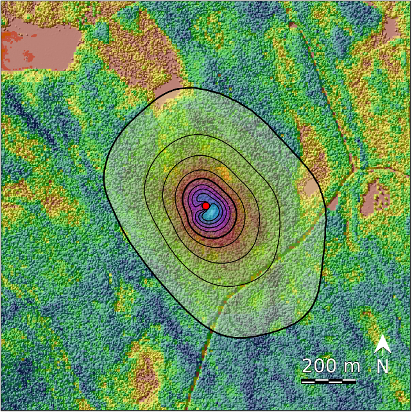
The ICOS site is located in the heart of the Krycklan catchment area, in the centre of a well investigated sub-catchment with long-term hydrological measurement. The Krycklan catchment is part of the national research infrastructure SITES and will host an ACTRIS Sweden from 2023 on. It also hosts other complementary measurements from various research projects.
Please, contact the station team for more information.
Facilities
Check the SLU's webpages on the Krycklan catchment areato get more information on facilities at Svartberget.
References
- Chi, J., M.B. Nilsson, H. Laudon, A. Lindroth, J. Wallerman, J. Fransson, N. Kljun, T. Lundmark, M. Ottosson Löfvenius, and M. Peichl, 2020. The Net Landscape Carbon Balance – integrating terrestrial and aquatic carbon fluxes in a managed boreal forest landscape in Sweden. Global Change Biology, 26: 2353-2367
- Laudon, H., E. Maher-Hasselquist, M. Peichl, K. Lindgren, R. Sponseller, F. Lidman, L. Kuglerová, N. J. Hasselquist, K. Bishop. M.B. Nilsson, A. M. Ågren. 2021. Northern landscapes in transition: evidence, approach and ways forward using the Krycklan Catchment Study. Hydrological Processes (in press), https://doi.org/10.1002/hyp.14170
ICOS ETC labeling report: